Figures are averages for that hour of each day in the time period analyzed.
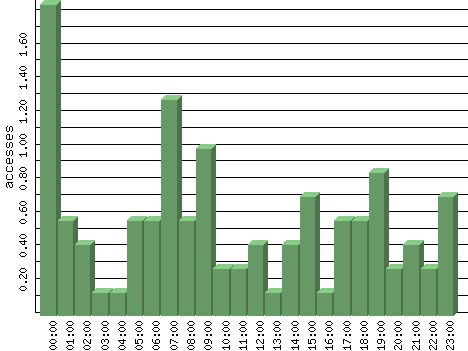
| Hour | Accesses | % | Bytes | % | Visits | % | Bits per Sec | Bytes per Sec |
|---|---|---|---|---|---|---|---|---|
| 00:00 | 1.86 | 13.98 | 165.57 | 2.05 | 0.00 | 0.00 | 0.37 | 0.05 |
| 01:00 | 0.57 | 4.30 | 496.57 | 6.14 | 0.00 | 0.00 | 1.10 | 0.14 |
| 02:00 | 0.43 | 3.23 | 275.71 | 3.41 | 0.00 | 0.00 | 0.61 | 0.08 |
| 03:00 | 0.14 | 1.08 | 220.86 | 2.73 | 0.00 | 0.00 | 0.49 | 0.06 |
| 04:00 | 0.14 | 1.08 | 27.43 | 0.34 | 0.00 | 0.00 | 0.06 | 0.01 |
| 05:00 | 0.57 | 4.30 | 109.71 | 1.36 | 0.00 | 0.00 | 0.24 | 0.03 |
| 06:00 | 0.57 | 4.30 | 109.71 | 1.36 | 0.00 | 0.00 | 0.24 | 0.03 |
| 07:00 | 1.29 | 9.68 | 440.29 | 5.44 | 0.00 | 0.00 | 0.98 | 0.12 |
| 08:00 | 0.57 | 4.30 | 496.57 | 6.14 | 0.00 | 0.00 | 1.10 | 0.14 |
| 09:00 | 1.00 | 7.53 | 192.00 | 2.37 | 0.00 | 0.00 | 0.43 | 0.05 |
| 10:00 | 0.29 | 2.15 | 248.29 | 3.07 | 0.00 | 0.00 | 0.55 | 0.07 |
| 11:00 | 0.29 | 2.15 | 54.86 | 0.68 | 0.00 | 0.00 | 0.12 | 0.02 |
| 12:00 | 0.43 | 3.23 | 275.71 | 3.41 | 0.00 | 0.00 | 0.61 | 0.08 |
| 13:00 | 0.14 | 1.08 | 27.43 | 0.34 | 0.00 | 0.00 | 0.06 | 0.01 |
| 14:00 | 0.43 | 3.23 | 82.29 | 1.02 | 0.00 | 0.00 | 0.18 | 0.02 |
| 15:00 | 0.71 | 5.38 | 137.14 | 1.70 | 0.00 | 0.00 | 0.30 | 0.04 |
| 16:00 | 0.14 | 1.08 | 27.43 | 0.34 | 0.00 | 0.00 | 0.06 | 0.01 |
| 17:00 | 0.57 | 4.30 | 690.00 | 8.53 | 0.00 | 0.00 | 1.53 | 0.19 |
| 18:00 | 0.57 | 4.30 | 303.14 | 3.75 | 0.00 | 0.00 | 0.67 | 0.08 |
| 19:00 | 0.86 | 6.45 | 54.86 | 0.68 | 0.00 | 0.00 | 0.12 | 0.02 |
| 20:00 | 0.29 | 2.15 | 1,717.71 | 21.23 | 0.00 | 0.00 | 3.82 | 0.48 |
| 21:00 | 0.43 | 3.23 | 82.29 | 1.02 | 0.00 | 0.00 | 0.18 | 0.02 |
| 22:00 | 0.29 | 2.15 | 54.86 | 0.68 | 0.00 | 0.00 | 0.12 | 0.02 |
| 23:00 | 0.71 | 5.38 | 1,800.00 | 22.25 | 0.00 | 0.00 | 4.00 | 0.50 |