Figures are averages for that hour of each day in the time period analyzed.
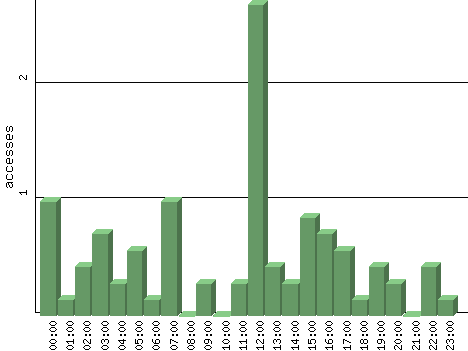
| Hour | Accesses | % | Bytes | % | Visits | % | Bits per Sec | Bytes per Sec |
|---|---|---|---|---|---|---|---|---|
| 00:00 | 1.00 | 8.43 | 1.00 | 0.05 | 0.00 | 0.00 | 0.00 | 0.00 |
| 01:00 | 0.14 | 1.20 | 27.43 | 1.40 | 0.00 | 0.00 | 0.06 | 0.01 |
| 02:00 | 0.43 | 3.61 | 82.29 | 4.20 | 0.00 | 0.00 | 0.18 | 0.02 |
| 03:00 | 0.71 | 6.02 | 137.14 | 7.00 | 0.00 | 0.00 | 0.30 | 0.04 |
| 04:00 | 0.29 | 2.41 | 54.86 | 2.80 | 0.00 | 0.00 | 0.12 | 0.02 |
| 05:00 | 0.57 | 4.82 | 109.71 | 5.60 | 0.00 | 0.00 | 0.24 | 0.03 |
| 06:00 | 0.14 | 1.20 | 27.43 | 1.40 | 0.00 | 0.00 | 0.06 | 0.01 |
| 07:00 | 1.00 | 8.43 | 192.00 | 9.80 | 0.00 | 0.00 | 0.43 | 0.05 |
| 08:00 | 0.00 | 0.00 | 0.00 | 0.00 | 0.00 | 0.00 | 0.00 | 0.00 |
| 09:00 | 0.29 | 2.41 | 27.43 | 1.40 | 0.00 | 0.00 | 0.06 | 0.01 |
| 10:00 | 0.00 | 0.00 | 0.00 | 0.00 | 0.00 | 0.00 | 0.00 | 0.00 |
| 11:00 | 0.29 | 2.41 | 27.43 | 1.40 | 0.00 | 0.00 | 0.06 | 0.01 |
| 12:00 | 2.71 | 22.89 | 586.29 | 29.93 | 0.00 | 0.00 | 1.30 | 0.16 |
| 13:00 | 0.43 | 3.61 | 82.29 | 4.20 | 0.00 | 0.00 | 0.18 | 0.02 |
| 14:00 | 0.29 | 2.41 | 54.86 | 2.80 | 1.29 | 100.00 | 0.12 | 0.02 |
| 15:00 | 0.86 | 7.23 | 164.57 | 8.40 | 0.00 | 0.00 | 0.37 | 0.05 |
| 16:00 | 0.71 | 6.02 | 109.71 | 5.60 | 0.00 | 0.00 | 0.24 | 0.03 |
| 17:00 | 0.57 | 4.82 | 0.00 | 0.00 | 0.00 | 0.00 | 0.00 | 0.00 |
| 18:00 | 0.14 | 1.20 | 27.43 | 1.40 | 0.00 | 0.00 | 0.06 | 0.01 |
| 19:00 | 0.43 | 3.61 | 82.29 | 4.20 | 0.00 | 0.00 | 0.18 | 0.02 |
| 20:00 | 0.29 | 2.41 | 54.86 | 2.80 | 0.00 | 0.00 | 0.12 | 0.02 |
| 21:00 | 0.00 | 0.00 | 0.00 | 0.00 | 0.00 | 0.00 | 0.00 | 0.00 |
| 22:00 | 0.43 | 3.61 | 82.29 | 4.20 | 0.00 | 0.00 | 0.18 | 0.02 |
| 23:00 | 0.14 | 1.20 | 27.43 | 1.40 | 0.00 | 0.00 | 0.06 | 0.01 |