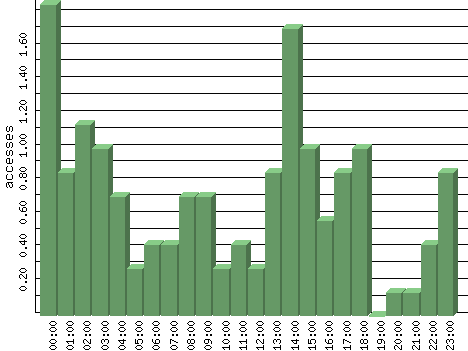
Figures are averages for that hour of each day in the time period analyzed.
| Hour | Accesses | % | Bytes | % | Visits | % | Bits per Sec | Bytes per Sec |
|---|---|---|---|---|---|---|---|---|
| 00:00 | 1.86 | 11.11 | 359.00 | 0.56 | 0.00 | 0.00 | 0.80 | 0.10 |
| 01:00 | 0.86 | 5.13 | 551.43 | 0.86 | 0.00 | 0.00 | 1.23 | 0.15 |
| 02:00 | 1.14 | 6.84 | 192.00 | 0.30 | 0.00 | 0.00 | 0.43 | 0.05 |
| 03:00 | 1.00 | 5.98 | 385.43 | 0.60 | 0.00 | 0.00 | 0.86 | 0.11 |
| 04:00 | 0.71 | 4.27 | 137.14 | 0.21 | 0.00 | 0.00 | 0.30 | 0.04 |
| 05:00 | 0.29 | 1.71 | 54.86 | 0.09 | 0.00 | 0.00 | 0.12 | 0.02 |
| 06:00 | 0.43 | 2.56 | 82.29 | 0.13 | 0.00 | 0.00 | 0.18 | 0.02 |
| 07:00 | 0.43 | 2.56 | 82.29 | 0.13 | 0.00 | 0.00 | 0.18 | 0.02 |
| 08:00 | 0.71 | 4.27 | 109.71 | 0.17 | 0.00 | 0.00 | 0.24 | 0.03 |
| 09:00 | 0.71 | 4.27 | 137.14 | 0.21 | 0.00 | 0.00 | 0.30 | 0.04 |
| 10:00 | 0.29 | 1.71 | 54.86 | 0.09 | 0.00 | 0.00 | 0.12 | 0.02 |
| 11:00 | 0.43 | 2.56 | 54.86 | 0.09 | 0.00 | 0.00 | 0.12 | 0.02 |
| 12:00 | 0.29 | 1.71 | 54.86 | 0.09 | 0.00 | 0.00 | 0.12 | 0.02 |
| 13:00 | 0.86 | 5.13 | 137.14 | 0.21 | 0.00 | 0.00 | 0.30 | 0.04 |
| 14:00 | 1.71 | 10.26 | 522.57 | 0.81 | 0.00 | 0.00 | 1.16 | 0.15 |
| 15:00 | 1.00 | 5.98 | 164.57 | 0.26 | 0.00 | 0.00 | 0.37 | 0.05 |
| 16:00 | 0.57 | 3.42 | 109.71 | 0.17 | 0.00 | 0.00 | 0.24 | 0.03 |
| 17:00 | 0.86 | 5.13 | 358.00 | 0.56 | 0.00 | 0.00 | 0.80 | 0.10 |
| 18:00 | 1.00 | 5.98 | 60,417.29 | 93.81 | 0.00 | 0.00 | 134.26 | 16.78 |
| 19:00 | 0.00 | 0.00 | 0.00 | 0.00 | 0.00 | 0.00 | 0.00 | 0.00 |
| 20:00 | 0.14 | 0.85 | 27.43 | 0.04 | 0.00 | 0.00 | 0.06 | 0.01 |
| 21:00 | 0.14 | 0.85 | 27.43 | 0.04 | 0.00 | 0.00 | 0.06 | 0.01 |
| 22:00 | 0.43 | 2.56 | 54.86 | 0.09 | 0.00 | 0.00 | 0.12 | 0.02 |
| 23:00 | 0.86 | 5.13 | 330.57 | 0.51 | 0.00 | 0.00 | 0.73 | 0.09 |