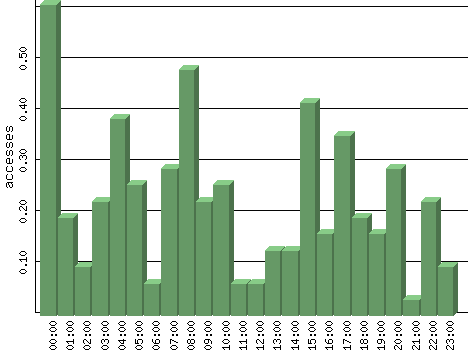
Figures are averages for that hour of each day in the time period analyzed.
| Hour | Accesses | % | Bytes | % | Visits | % | Bits per Sec | Bytes per Sec |
|---|---|---|---|---|---|---|---|---|
| 00:00 | 0.61 | 11.31 | 25.19 | 1.52 | 0.00 | 0.00 | 0.06 | 0.01 |
| 01:00 | 0.19 | 3.57 | 37.16 | 2.24 | 0.00 | 0.00 | 0.08 | 0.01 |
| 02:00 | 0.10 | 1.79 | 18.58 | 1.12 | 0.00 | 0.00 | 0.04 | 0.01 |
| 03:00 | 0.23 | 4.17 | 43.35 | 2.61 | 0.00 | 0.00 | 0.10 | 0.01 |
| 04:00 | 0.39 | 7.14 | 43.35 | 2.61 | 0.00 | 0.00 | 0.10 | 0.01 |
| 05:00 | 0.26 | 4.76 | 49.55 | 2.99 | 0.00 | 0.00 | 0.11 | 0.01 |
| 06:00 | 0.06 | 1.19 | 12.39 | 0.75 | 0.00 | 0.00 | 0.03 | 0.00 |
| 07:00 | 0.29 | 5.36 | 55.74 | 3.36 | 0.00 | 0.00 | 0.12 | 0.02 |
| 08:00 | 0.48 | 8.93 | 174.06 | 10.49 | 0.00 | 0.00 | 0.39 | 0.05 |
| 09:00 | 0.23 | 4.17 | 87.03 | 5.24 | 0.00 | 0.00 | 0.19 | 0.02 |
| 10:00 | 0.26 | 4.76 | 80.84 | 4.87 | 0.00 | 0.00 | 0.18 | 0.02 |
| 11:00 | 0.06 | 1.19 | 12.39 | 0.75 | 0.00 | 0.00 | 0.03 | 0.00 |
| 12:00 | 0.06 | 1.19 | 56.06 | 3.38 | 0.00 | 0.00 | 0.12 | 0.02 |
| 13:00 | 0.13 | 2.38 | 68.45 | 4.12 | 0.00 | 0.00 | 0.15 | 0.02 |
| 14:00 | 0.13 | 2.38 | 18.58 | 1.12 | 0.00 | 0.00 | 0.04 | 0.01 |
| 15:00 | 0.42 | 7.74 | 80.52 | 4.85 | 0.00 | 0.00 | 0.18 | 0.02 |
| 16:00 | 0.16 | 2.98 | 30.97 | 1.87 | 0.00 | 0.00 | 0.07 | 0.01 |
| 17:00 | 0.35 | 6.55 | 267.94 | 16.14 | 0.26 | 100.00 | 0.60 | 0.07 |
| 18:00 | 0.19 | 3.57 | 168.19 | 10.13 | 0.00 | 0.00 | 0.37 | 0.05 |
| 19:00 | 0.16 | 2.98 | 162.00 | 9.76 | 0.00 | 0.00 | 0.36 | 0.05 |
| 20:00 | 0.29 | 5.36 | 55.74 | 3.36 | 0.00 | 0.00 | 0.12 | 0.02 |
| 21:00 | 0.03 | 0.60 | 6.19 | 0.37 | 0.00 | 0.00 | 0.01 | 0.00 |
| 22:00 | 0.23 | 4.17 | 43.35 | 2.61 | 0.00 | 0.00 | 0.10 | 0.01 |
| 23:00 | 0.10 | 1.79 | 62.26 | 3.75 | 0.00 | 0.00 | 0.14 | 0.02 |