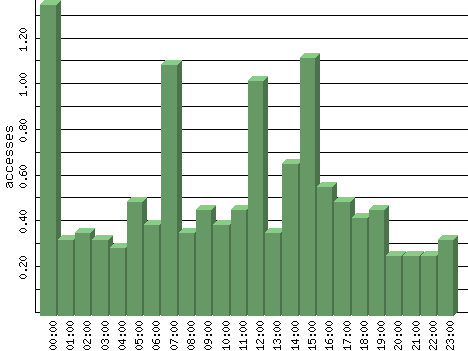
Figures are averages for that hour of each day in the time period analyzed.
| Hour | Accesses | % | Bytes | % | Visits | % | Bits per Sec | Bytes per Sec |
|---|---|---|---|---|---|---|---|---|
| 00:00 | 1.37 | 10.76 | 71.40 | 1.64 | 0.00 | 0.00 | 0.16 | 0.02 |
| 01:00 | 0.33 | 2.62 | 147.87 | 3.39 | 0.00 | 0.00 | 0.33 | 0.04 |
| 02:00 | 0.37 | 2.89 | 109.13 | 2.50 | 0.00 | 0.00 | 0.24 | 0.03 |
| 03:00 | 0.33 | 2.62 | 102.73 | 2.35 | 0.00 | 0.00 | 0.23 | 0.03 |
| 04:00 | 0.30 | 2.36 | 102.73 | 2.35 | 0.00 | 0.00 | 0.23 | 0.03 |
| 05:00 | 0.50 | 3.94 | 89.60 | 2.05 | 0.00 | 0.00 | 0.20 | 0.02 |
| 06:00 | 0.40 | 3.15 | 70.40 | 1.61 | 0.00 | 0.00 | 0.16 | 0.02 |
| 07:00 | 1.10 | 8.66 | 295.07 | 6.76 | 0.00 | 0.00 | 0.66 | 0.08 |
| 08:00 | 0.37 | 2.89 | 160.67 | 3.68 | 0.00 | 0.00 | 0.36 | 0.04 |
| 09:00 | 0.47 | 3.67 | 128.33 | 2.94 | 0.17 | 23.81 | 0.29 | 0.04 |
| 10:00 | 0.40 | 3.15 | 212.20 | 4.86 | 0.00 | 0.00 | 0.47 | 0.06 |
| 11:00 | 0.47 | 3.67 | 173.47 | 3.98 | 0.00 | 0.00 | 0.39 | 0.05 |
| 12:00 | 1.03 | 8.14 | 387.73 | 8.89 | 0.00 | 0.00 | 0.86 | 0.11 |
| 13:00 | 0.37 | 2.89 | 70.40 | 1.61 | 0.00 | 0.00 | 0.16 | 0.02 |
| 14:00 | 0.67 | 5.25 | 194.73 | 4.46 | 0.30 | 42.86 | 0.43 | 0.05 |
| 15:00 | 1.13 | 8.92 | 262.73 | 6.02 | 0.23 | 33.33 | 0.58 | 0.07 |
| 16:00 | 0.57 | 4.46 | 192.67 | 4.42 | 0.00 | 0.00 | 0.43 | 0.05 |
| 17:00 | 0.50 | 3.94 | 341.20 | 7.82 | 0.00 | 0.00 | 0.76 | 0.09 |
| 18:00 | 0.43 | 3.41 | 121.93 | 2.79 | 0.00 | 0.00 | 0.27 | 0.03 |
| 19:00 | 0.47 | 3.67 | 109.13 | 2.50 | 0.00 | 0.00 | 0.24 | 0.03 |
| 20:00 | 0.27 | 2.10 | 439.20 | 10.06 | 0.00 | 0.00 | 0.98 | 0.12 |
| 21:00 | 0.27 | 2.10 | 44.80 | 1.03 | 0.00 | 0.00 | 0.10 | 0.01 |
| 22:00 | 0.27 | 2.10 | 51.20 | 1.17 | 0.00 | 0.00 | 0.11 | 0.01 |
| 23:00 | 0.33 | 2.62 | 484.33 | 11.10 | 0.00 | 0.00 | 1.08 | 0.13 |