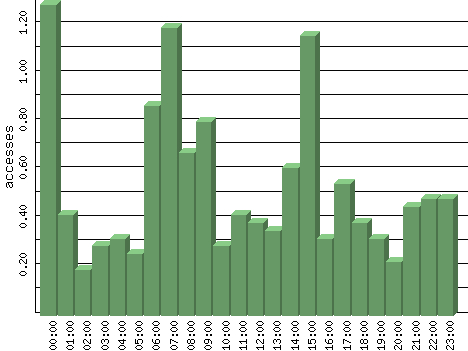
Figures are averages for that hour of each day in the time period analyzed.
| Hour | Accesses | % | Bytes | % | Visits | % | Bits per Sec | Bytes per Sec |
|---|---|---|---|---|---|---|---|---|
| 00:00 | 1.29 | 10.10 | 44.35 | 0.85 | 0.00 | 0.00 | 0.10 | 0.01 |
| 01:00 | 0.42 | 3.28 | 74.32 | 1.42 | 0.00 | 0.00 | 0.17 | 0.02 |
| 02:00 | 0.19 | 1.52 | 30.97 | 0.59 | 0.00 | 0.00 | 0.07 | 0.01 |
| 03:00 | 0.29 | 2.27 | 55.74 | 1.06 | 0.00 | 0.00 | 0.12 | 0.02 |
| 04:00 | 0.32 | 2.53 | 61.94 | 1.18 | 0.00 | 0.00 | 0.14 | 0.02 |
| 05:00 | 0.26 | 2.02 | 43.35 | 0.83 | 0.00 | 0.00 | 0.10 | 0.01 |
| 06:00 | 0.87 | 6.82 | 2,982.00 | 56.93 | 0.00 | 0.00 | 6.63 | 0.83 |
| 07:00 | 1.19 | 9.34 | 216.77 | 4.14 | 0.00 | 0.00 | 0.48 | 0.06 |
| 08:00 | 0.68 | 5.30 | 99.10 | 1.89 | 0.23 | 36.84 | 0.22 | 0.03 |
| 09:00 | 0.81 | 6.31 | 212.13 | 4.05 | 0.00 | 0.00 | 0.47 | 0.06 |
| 10:00 | 0.29 | 2.27 | 49.55 | 0.95 | 0.00 | 0.00 | 0.11 | 0.01 |
| 11:00 | 0.42 | 3.28 | 87.10 | 1.66 | 0.00 | 0.00 | 0.19 | 0.02 |
| 12:00 | 0.39 | 3.03 | 80.90 | 1.54 | 0.00 | 0.00 | 0.18 | 0.02 |
| 13:00 | 0.35 | 2.78 | 144.00 | 2.75 | 0.00 | 0.00 | 0.32 | 0.04 |
| 14:00 | 0.61 | 4.80 | 117.68 | 2.25 | 0.00 | 0.00 | 0.26 | 0.03 |
| 15:00 | 1.16 | 9.09 | 279.87 | 5.34 | 0.00 | 0.00 | 0.62 | 0.08 |
| 16:00 | 0.32 | 2.53 | 137.81 | 2.63 | 0.00 | 0.00 | 0.31 | 0.04 |
| 17:00 | 0.55 | 4.29 | 105.29 | 2.01 | 0.16 | 26.32 | 0.23 | 0.03 |
| 18:00 | 0.39 | 3.03 | 61.94 | 1.18 | 0.00 | 0.00 | 0.14 | 0.02 |
| 19:00 | 0.32 | 2.53 | 61.94 | 1.18 | 0.00 | 0.00 | 0.14 | 0.02 |
| 20:00 | 0.23 | 1.77 | 24.77 | 0.47 | 0.23 | 36.84 | 0.06 | 0.01 |
| 21:00 | 0.45 | 3.54 | 86.71 | 1.66 | 0.00 | 0.00 | 0.19 | 0.02 |
| 22:00 | 0.48 | 3.79 | 86.71 | 1.66 | 0.00 | 0.00 | 0.19 | 0.02 |
| 23:00 | 0.48 | 3.79 | 92.90 | 1.77 | 0.00 | 0.00 | 0.21 | 0.03 |