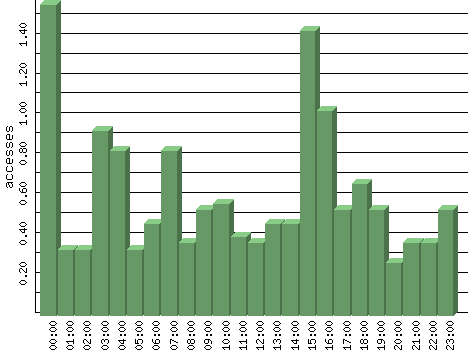
Figures are averages for that hour of each day in the time period analyzed.
| Hour | Accesses | % | Bytes | % | Visits | % | Bits per Sec | Bytes per Sec |
|---|---|---|---|---|---|---|---|---|
| 00:00 | 1.57 | 10.78 | 168.07 | 1.82 | 0.00 | 0.00 | 0.37 | 0.05 |
| 01:00 | 0.33 | 2.29 | 32.00 | 0.35 | 0.00 | 0.00 | 0.07 | 0.01 |
| 02:00 | 0.33 | 2.29 | 77.13 | 0.83 | 0.00 | 0.00 | 0.17 | 0.02 |
| 03:00 | 0.93 | 6.42 | 257.00 | 2.78 | 0.00 | 0.00 | 0.57 | 0.07 |
| 04:00 | 0.83 | 5.73 | 134.40 | 1.45 | 0.00 | 0.00 | 0.30 | 0.04 |
| 05:00 | 0.33 | 2.29 | 44.80 | 0.48 | 0.00 | 0.00 | 0.10 | 0.01 |
| 06:00 | 0.47 | 3.21 | 70.40 | 0.76 | 0.00 | 0.00 | 0.16 | 0.02 |
| 07:00 | 0.83 | 5.73 | 162.40 | 1.75 | 0.30 | 27.27 | 0.36 | 0.05 |
| 08:00 | 0.37 | 2.52 | 96.33 | 1.04 | 0.27 | 24.24 | 0.21 | 0.03 |
| 09:00 | 0.53 | 3.67 | 76.80 | 0.83 | 0.00 | 0.00 | 0.17 | 0.02 |
| 10:00 | 0.57 | 3.90 | 128.33 | 1.39 | 0.00 | 0.00 | 0.29 | 0.04 |
| 11:00 | 0.40 | 2.75 | 70.40 | 0.76 | 0.00 | 0.00 | 0.16 | 0.02 |
| 12:00 | 0.37 | 2.52 | 6,362.53 | 68.75 | 0.00 | 0.00 | 14.14 | 1.77 |
| 13:00 | 0.47 | 3.21 | 263.73 | 2.85 | 0.00 | 0.00 | 0.59 | 0.07 |
| 14:00 | 0.47 | 3.21 | 134.73 | 1.46 | 0.00 | 0.00 | 0.30 | 0.04 |
| 15:00 | 1.43 | 9.86 | 268.80 | 2.90 | 0.00 | 0.00 | 0.60 | 0.07 |
| 16:00 | 1.03 | 7.11 | 297.47 | 3.21 | 0.00 | 0.00 | 0.66 | 0.08 |
| 17:00 | 0.53 | 3.67 | 147.53 | 1.59 | 0.00 | 0.00 | 0.33 | 0.04 |
| 18:00 | 0.67 | 4.59 | 102.40 | 1.11 | 0.30 | 27.27 | 0.23 | 0.03 |
| 19:00 | 0.53 | 3.67 | 76.80 | 0.83 | 0.23 | 21.21 | 0.17 | 0.02 |
| 20:00 | 0.27 | 1.83 | 44.80 | 0.48 | 0.00 | 0.00 | 0.10 | 0.01 |
| 21:00 | 0.37 | 2.52 | 64.00 | 0.69 | 0.00 | 0.00 | 0.14 | 0.02 |
| 22:00 | 0.37 | 2.52 | 96.33 | 1.04 | 0.00 | 0.00 | 0.21 | 0.03 |
| 23:00 | 0.53 | 3.67 | 76.80 | 0.83 | 0.00 | 0.00 | 0.17 | 0.02 |