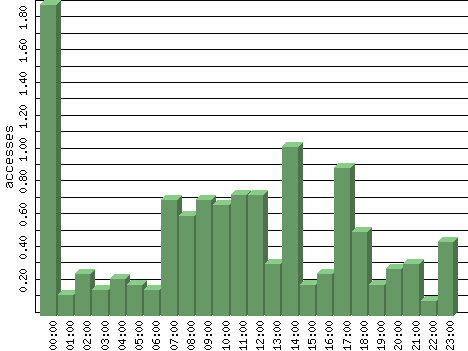
Figures are averages for that hour of each day in the time period analyzed.
| Hour | Accesses | % | Bytes | % | Visits | % | Bits per Sec | Bytes per Sec |
|---|---|---|---|---|---|---|---|---|
| 00:00 | 1.90 | 16.12 | 162.03 | 6.59 | 0.00 | 0.00 | 0.36 | 0.05 |
| 01:00 | 0.13 | 1.09 | 18.58 | 0.76 | 0.00 | 0.00 | 0.04 | 0.01 |
| 02:00 | 0.26 | 2.19 | 49.55 | 2.01 | 0.00 | 0.00 | 0.11 | 0.01 |
| 03:00 | 0.16 | 1.37 | 24.77 | 1.01 | 0.00 | 0.00 | 0.06 | 0.01 |
| 04:00 | 0.23 | 1.91 | 43.35 | 1.76 | 0.00 | 0.00 | 0.10 | 0.01 |
| 05:00 | 0.19 | 1.64 | 37.16 | 1.51 | 0.00 | 0.00 | 0.08 | 0.01 |
| 06:00 | 0.16 | 1.37 | 30.97 | 1.26 | 0.00 | 0.00 | 0.07 | 0.01 |
| 07:00 | 0.71 | 6.01 | 130.06 | 5.29 | 0.00 | 0.00 | 0.29 | 0.04 |
| 08:00 | 0.61 | 5.19 | 117.68 | 4.79 | 0.00 | 0.00 | 0.26 | 0.03 |
| 09:00 | 0.71 | 6.01 | 150.97 | 6.14 | 0.00 | 0.00 | 0.34 | 0.04 |
| 10:00 | 0.68 | 5.74 | 130.06 | 5.29 | 0.00 | 0.00 | 0.29 | 0.04 |
| 11:00 | 0.74 | 6.28 | 138.58 | 5.64 | 0.00 | 0.00 | 0.31 | 0.04 |
| 12:00 | 0.74 | 6.28 | 130.06 | 5.29 | 0.29 | 37.50 | 0.29 | 0.04 |
| 13:00 | 0.32 | 2.73 | 49.55 | 2.01 | 0.23 | 29.17 | 0.11 | 0.01 |
| 14:00 | 1.03 | 8.74 | 192.00 | 7.81 | 0.00 | 0.00 | 0.43 | 0.05 |
| 15:00 | 0.19 | 1.64 | 37.16 | 1.51 | 0.00 | 0.00 | 0.08 | 0.01 |
| 16:00 | 0.26 | 2.19 | 37.16 | 1.51 | 0.00 | 0.00 | 0.08 | 0.01 |
| 17:00 | 0.90 | 7.65 | 262.94 | 10.69 | 0.26 | 33.33 | 0.58 | 0.07 |
| 18:00 | 0.52 | 4.37 | 86.71 | 3.53 | 0.00 | 0.00 | 0.19 | 0.02 |
| 19:00 | 0.19 | 1.64 | 30.97 | 1.26 | 0.00 | 0.00 | 0.07 | 0.01 |
| 20:00 | 0.29 | 2.46 | 418.84 | 17.03 | 0.00 | 0.00 | 0.93 | 0.12 |
| 21:00 | 0.32 | 2.73 | 55.74 | 2.27 | 0.00 | 0.00 | 0.12 | 0.02 |
| 22:00 | 0.10 | 0.82 | 18.58 | 0.76 | 0.00 | 0.00 | 0.04 | 0.01 |
| 23:00 | 0.45 | 3.83 | 105.68 | 4.30 | 0.00 | 0.00 | 0.23 | 0.03 |